
We’re always curious about how users access websites and what content they are most interested in–especially regarding our own site! We dug through recent analytics and pulled some key findings to share.
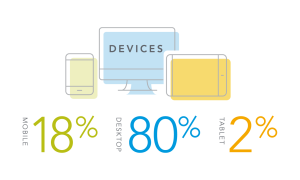
DEVICE BREAKDOWN
Our website, like every site that we design, is fully responsive. Knowing if you have a majority of desktop viewers (often the case with our B2B clients) versus a majority of mobile viewers (well over 50% on many of our hospitality or consumer brand sites) is helpful. It can influence how you’d want information presented, or where you should focus your time regarding site updates. Our stats were pretty in line with our expectations:
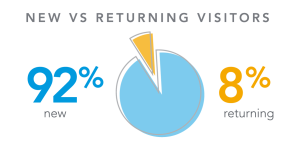
SITE VISITORS
It’s always worth looking at the breakdown of site visitors, to see new versus returning users. If your objectives are focused on new business, increasing new visitors might be a top goal. Whereas if you’re focused on providing lots of great, timely content for people to constantly seek out, seeing more and more repeat visitors helps you realize what is working. For us, it is exciting to see that returning visitors are up by 2% from 2017:
HIGHEST PAGE VIEWS
The area of our website where we focus most of our time and energy is definitely our portfolio. It is excellent to see that our dedication seems to be paying off, as the highest page views on our website are on our Work page. This is where we showcase our latest and greatest projects and keeping it fresh is key. Take a peek at what we’re up to!

REFERRALS
Knowing how users get to your site is crucial. With so many sources, from Google to social media to other referring sites linking to you, analyzing traffic in this way gets interesting fast. We’ve been getting the most referrals in 2018 from FTV Capital with The Black Dog in a close second!

MOST BLOG POST VIEWS
We like to keep our visitors up to date with the latest on things like design, development, and marketing. Stats that show what posts are getting the most attention are useful for future content strategies and overall planning. Our very own Jason Larose wrote an amazing blog post on Affinity Photo and Affinity Designer which brought in a whopping 2,388 unique page views in 2018!

POPULARITY CONTEST
It’s always fun to see what content is getting the most views, along with when and how. Some of the popularity stats we like to take a peek at include:

We’ll see what this year brings to the world of analytics!